Airborne Research Stories
Validation of TROPOMI tropospheric NO2 product based on APEX hyperspectral data: the S5PVAL-BE campaign in Belgium
By IORDACHE Marian-Daniel, REUSEN Ils, TACK Frederik
Sentinel-5P (S-5P) is the first mission of the European Union’s Earth Observation Programme, Copernicus, dedicated to the monitoring of air quality, climate and ozone. The instrument on-board S5-P is the TROPOspheric Monitoring Instrument (TROPOMI) nadir-viewing spectrometer. The tropospheric nitrogen dioxide (NO2) product, with a spatial resolution of 3.5 x 7 km2 at nadir observations, is one of the most valuable assets of the mission, as NO2 is a trace gas with documented harmful effects on human health. In Europe, the principal sources of NO2 are the fuel combustion due to traffic, domestic heating and industrial activities. It has a lifetime in the order of hours and is characterized by a strong spatio-temporal variability when close to the emission sources. Thus, the monitoring of NO2 levels, especially in urban agglomerations, is a valuable tool for policy makers in defining strategies to mitigate the effects of this harmful gas on population.
The Airborne Prism Experiment (APEX) sensor is an airborne hyperspectral sensor built on behalf of ESA by a Swiss-Belgian consortium, currently under joint ownership of the Flemish Institute for Technological Research (VITO, Belgium) and Remote Sensing Laboratories (University of Zurich, Switzerland). In the last years, VITO and the Royal Belgian Institute for Space Aeronomy (BIRA-IASB) have teamed-up with various partners to employ APEX data in projects such as BUMBA, AROMAT, AROMAPEX, dedicated to NO2 mapping over heavily polluted cities, e.g. Antwerp, Brussels, Liége and Berlin. These campaigns, funded by ESA and BELSPO (Belgian Science Policy), confirmed that, due to its high spatial resolution and high spectral resolution around the wavelengths of interest, APEX is a reliable instrument for mapping NO2 in highly heterogeneous environments such as large cities.
In June 2019, in the framework of the S5PVAL-BE campaign funded by BELSPO’s STEREO programme, the TROPOMI NO2 product has been validated over strongly polluted Belgian urban regions by comparison with coincident high-resolution APEX remote sensing observations (~100 m2 after spatial binning). The APEX airborne observations offer the optimal means for the validation of satellite observations, as a large number of satellite pixels can be mapped at high spatial resolution and in a relatively short period of time, thus the impact of spatio-temporal mismatches is largely reduced. Four flights were performed during the S5PVAL-BE campaign simultaneously with Sentinel-5P overpasses - two over Antwerp (27 and 29 June), where the petrochemical industry is the largest source of NO2, and two over Brussels (26 and 28 June), where the traffic emissions are dominant. Ground teams were deployed in the field during the flights, in order to gather field measurements for the validation of the observed APEX spectra and the retrieved NO2 product. Other auxiliary data, e.g. temperature and wind characteristics, were gathered from weather stations of the Belgian Royal Meteorological Institute (RMI). The APEX NO2 retrieval uses as input customized datasets, e.g. dark-current corrected imagery, produced by VITO Remote Sensing for the spectral region 470-510nm.
During each flight of 1.5-2 hours, 10 to 20 TROPOMI pixels were covered by approximately 2800 to 4000 APEX measurements within each TROPOMI pixel. Figures 2 and 3 show the tropospheric NO2 VCDs (vertical column densities) retrieved from APEX spectra in Antwerp and Brussels, respectively. In these figures, different colour scales were applied in order to optimize the dynamic range of each dataset. Red dots indicate point sources emitting more than 10kg of NOx per hour, according to the emission inventory (2017) of the Belgian Interregional Environment Agency. Coinciding TROPOMI tropospheric NO2 VCD retrievals are overlaid as color-coded polygons. It can be observed that, in Antwerp, industrial emission sources of NO2 can be differentiated and localized due to the high spatial resolution of APEX, while in Brussels the plume has a more diffuse nature, originating from the traffic along busy roads.
For a statistical analysis involving TROPOMI-APEX NO2 comparison, we considered all TROPOMI pixels that had at least half of their area covered by APEX pixels. Time differences between the satellite overpasses and APEX acquisitions were less than one hour. A scatterplot and linear regression analysis of co-located TROPOMI and averaged APEX NO2 VCD retrievals for the ensemble of the four flights is shown in Figure 4.
The two regression lines in Figure 4 correspond to two different a priori NO2 profile shapes – standard TM5 profiles in grey colour, locally derived CAMS profiles in black colour - used in the retrieval process. Overall for the ensemble of the four flights, a good agreement can be observed for both retrievals. The standard TROPOMI NO2 VCD product (grey line in Figure 4) is well correlated (R= 0.92) to APEX NO2 reference observations, but biased negatively, on average, with -14% ± 12%. This bias is attributed to the limited TROPOMI spatial resolution with respect to fine-scale gradients occurring in polluted areas and to the limited spatial resolution of the TM5 a priori NO2 profiles. When a higher resolution a priori NO2 profile is used (black line in Figure 4), the bias is drastically reduced to -1.0% ± 12%, while the correlation coefficient also slightly improves (R=0.93).
When the absolute value of the difference is considered, the bias varies from 16% (TM5 a priori NO2 profile shapes) to 9% (CAMS profiles), on average. In general, a stronger bias can be observed for high VCDs, related to the larger uncertainties on both the APEX and TROPOMI retrievals. However, it can be observed that both sets of retrievals are well within the accuracy requirement of a maximum bias of 25-50% for the TROPOMI tropospheric NO2 product for all individual compared pixels.
The impact of smearing of the effective signal due to the finite satellite pixel size was also studied by donwsampling the APEX retrievals. It was shown that the underestimation of peak plume values and overestimation of urban background in the TROPOMI data is expected to be, on average, of 10% - 20%, depending on the amount of heterogeneity in the NO2 field. However, the observation of relatively large pixels causes a strong smoothing effect in the case of strongly polluted scenes with steep gradients. This effect is illustrated in Figure 5, where the relative bias (in percentage) between pseudo-TROPOMI NO2 values (simulated as averaged APEX retrievals) and APEX NO2 values is illustrated for a virtual grid with cell size of 4.4 x 4.4 km2. This figure proves that the strongest under- and overestimation appears over and in the vicinity of the main plumes, and more specifically over transition regions, and it is expected that the smoothing will be stronger when spatial gradients become stronger.
The S5PVAL-BE campaign is one of the pioneering studies related to the validation of TROPOMI tropospheric NO2 retrievals based on airborne hyperspectral data. The main focus was to quantify the retrieval uncertainties in polluted regions and it showed that the TROPOMI NO2 product meets the requirements in terms of accuracy and precision. At the same time, it brings a plethora of opportunities for enlarged studies on the subject under different conditions, e.g. in areas with different geophysical properties, different albedo, different seasons, among others, while upcoming satellite missions could also benefit from the implemented validation methodology.
More results derived from the S5PVAL-BE campaign can be found in the following publication:
Tack, F., Merlaud, A., Iordache, M.-D., Pinardi, G., Dimitropoulou, E., Eskes, H., Bomans, B., Veefkind, P., and Van Roozendael, M.: Assessment of the TROPOMI tropospheric NO2 product based on airborne APEX observations, Atmos. Meas. Tech. Discuss., https://doi.org/10.5194/amt-2020-148, in review, 2020.
Orginally published on Oct. 19, 2020, 18:31
Last update on June 30, 2025, 20:29
Article gallery
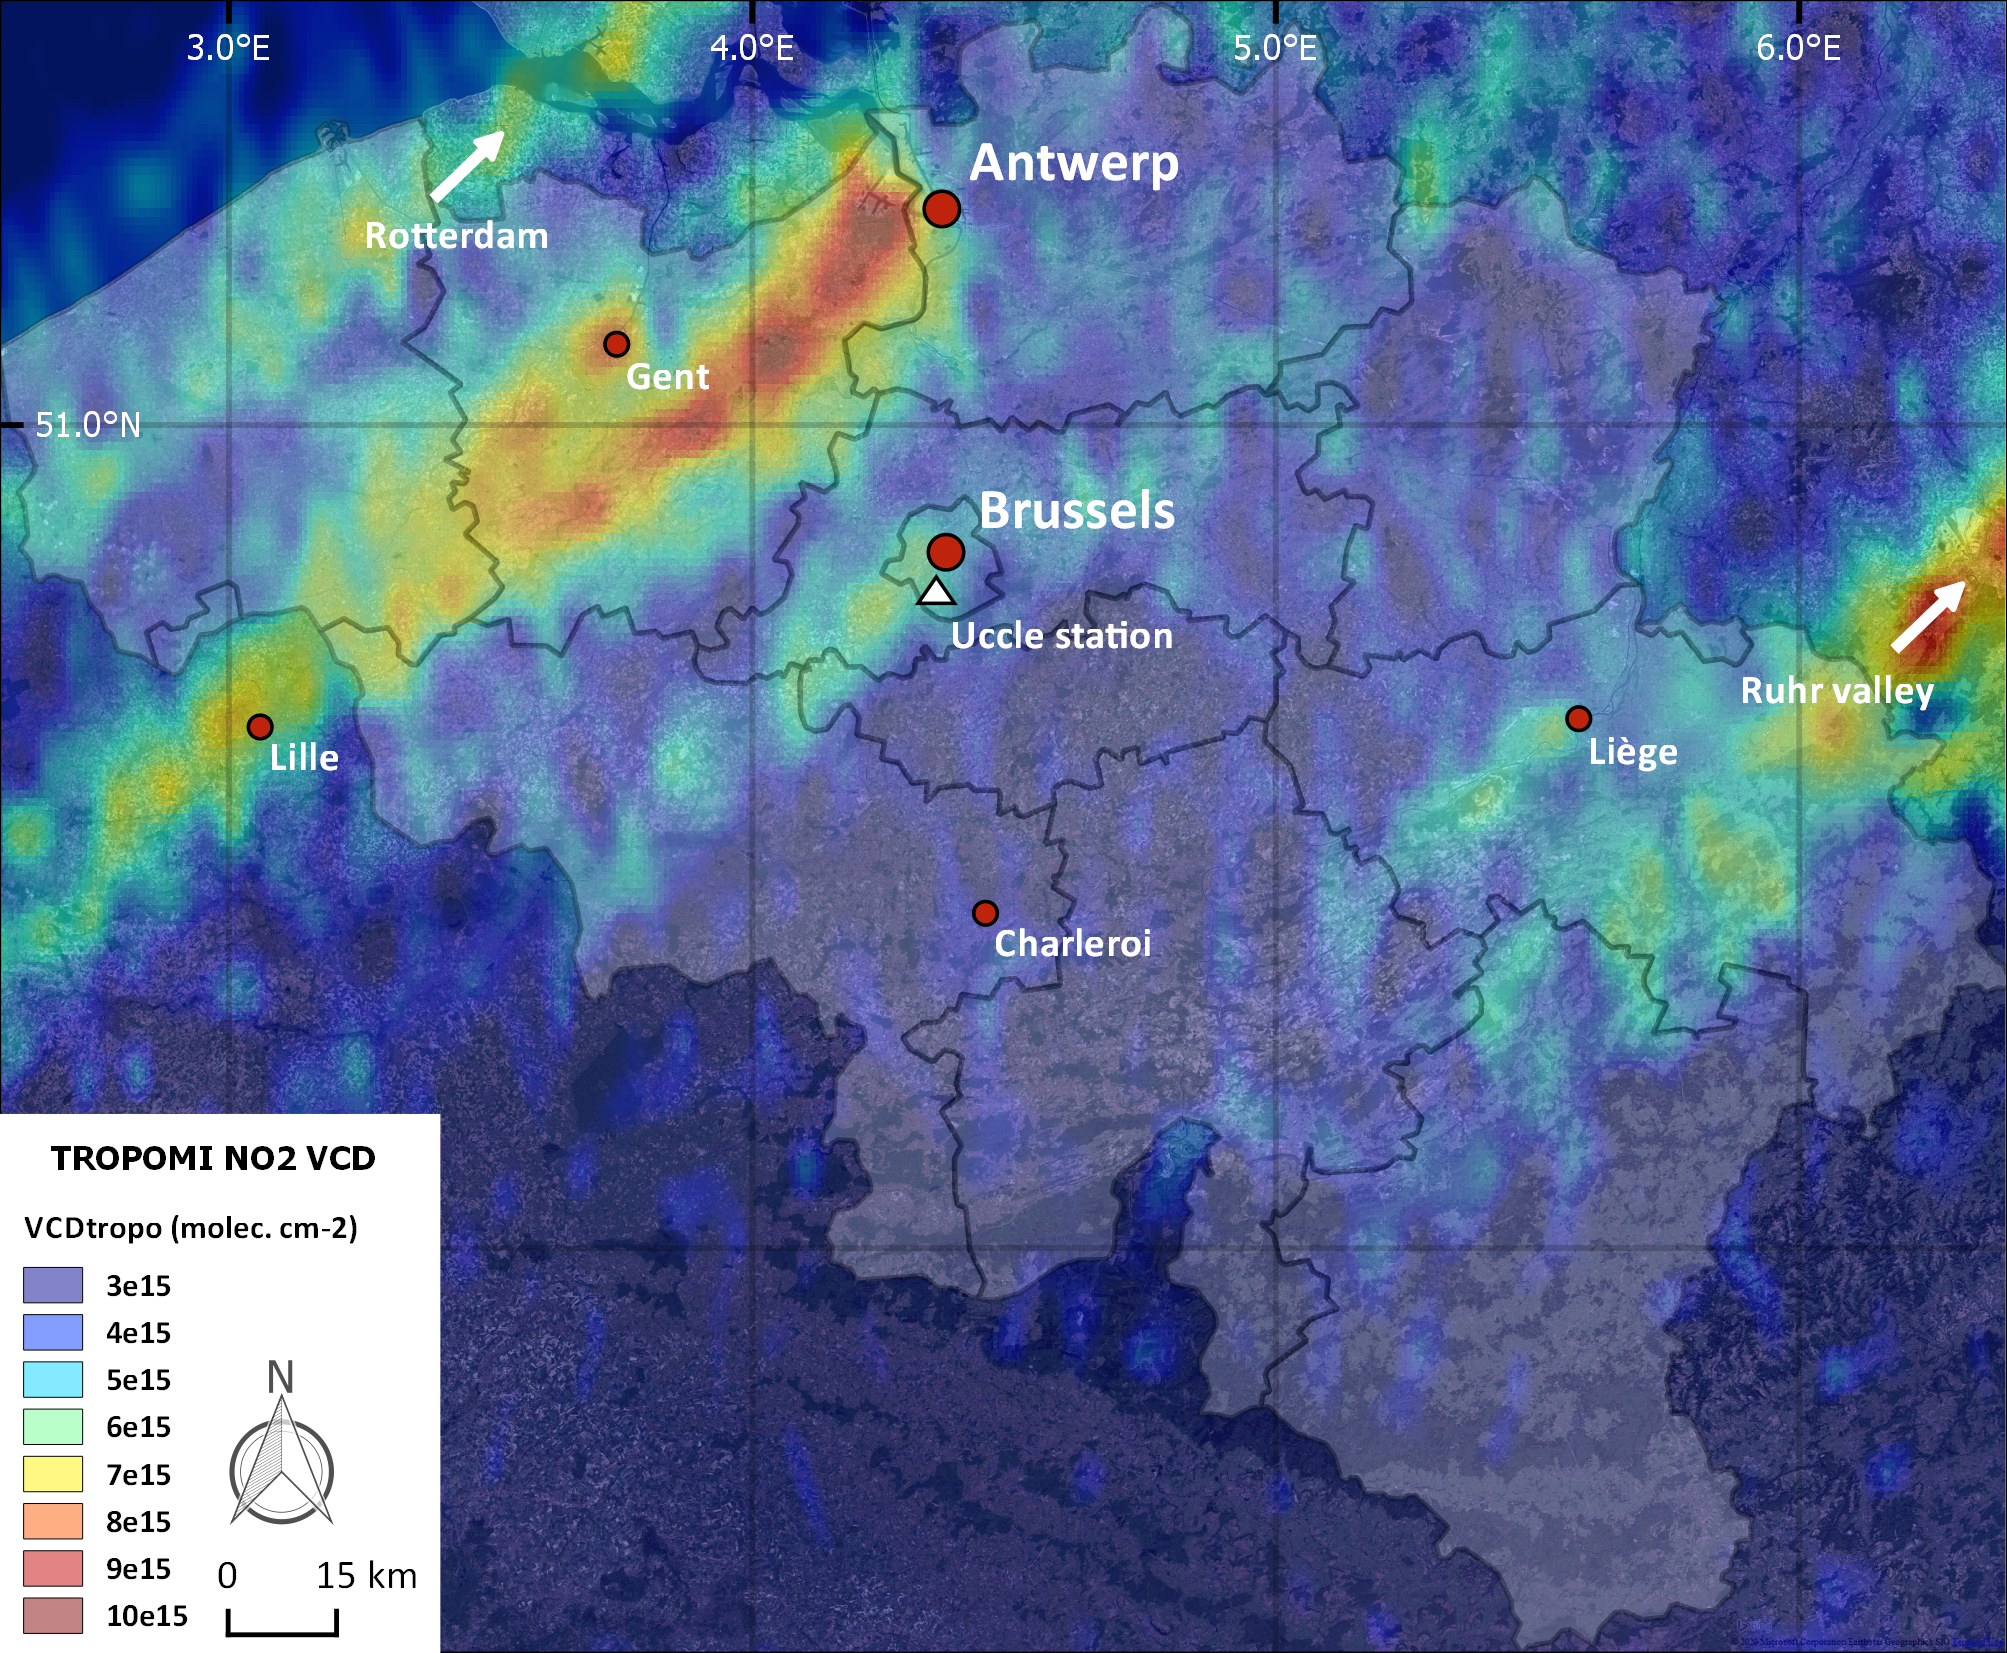
Figure 1
Tropospheric NO2 hotspots observed over Belgium by TROPOMI, based on an early afternoon S-5P orbit (8826) on 27 June 2019 5 (OFFL v1.03.01 – thin plate spline interpolation at 0.01°). Red markers indicate the five largest Belgian cities. White arrows indicate the source locations for long-range transport plumes over Belgium, e.g. from Rotterdam and the Ruhr area in case of a northeasterly wind.
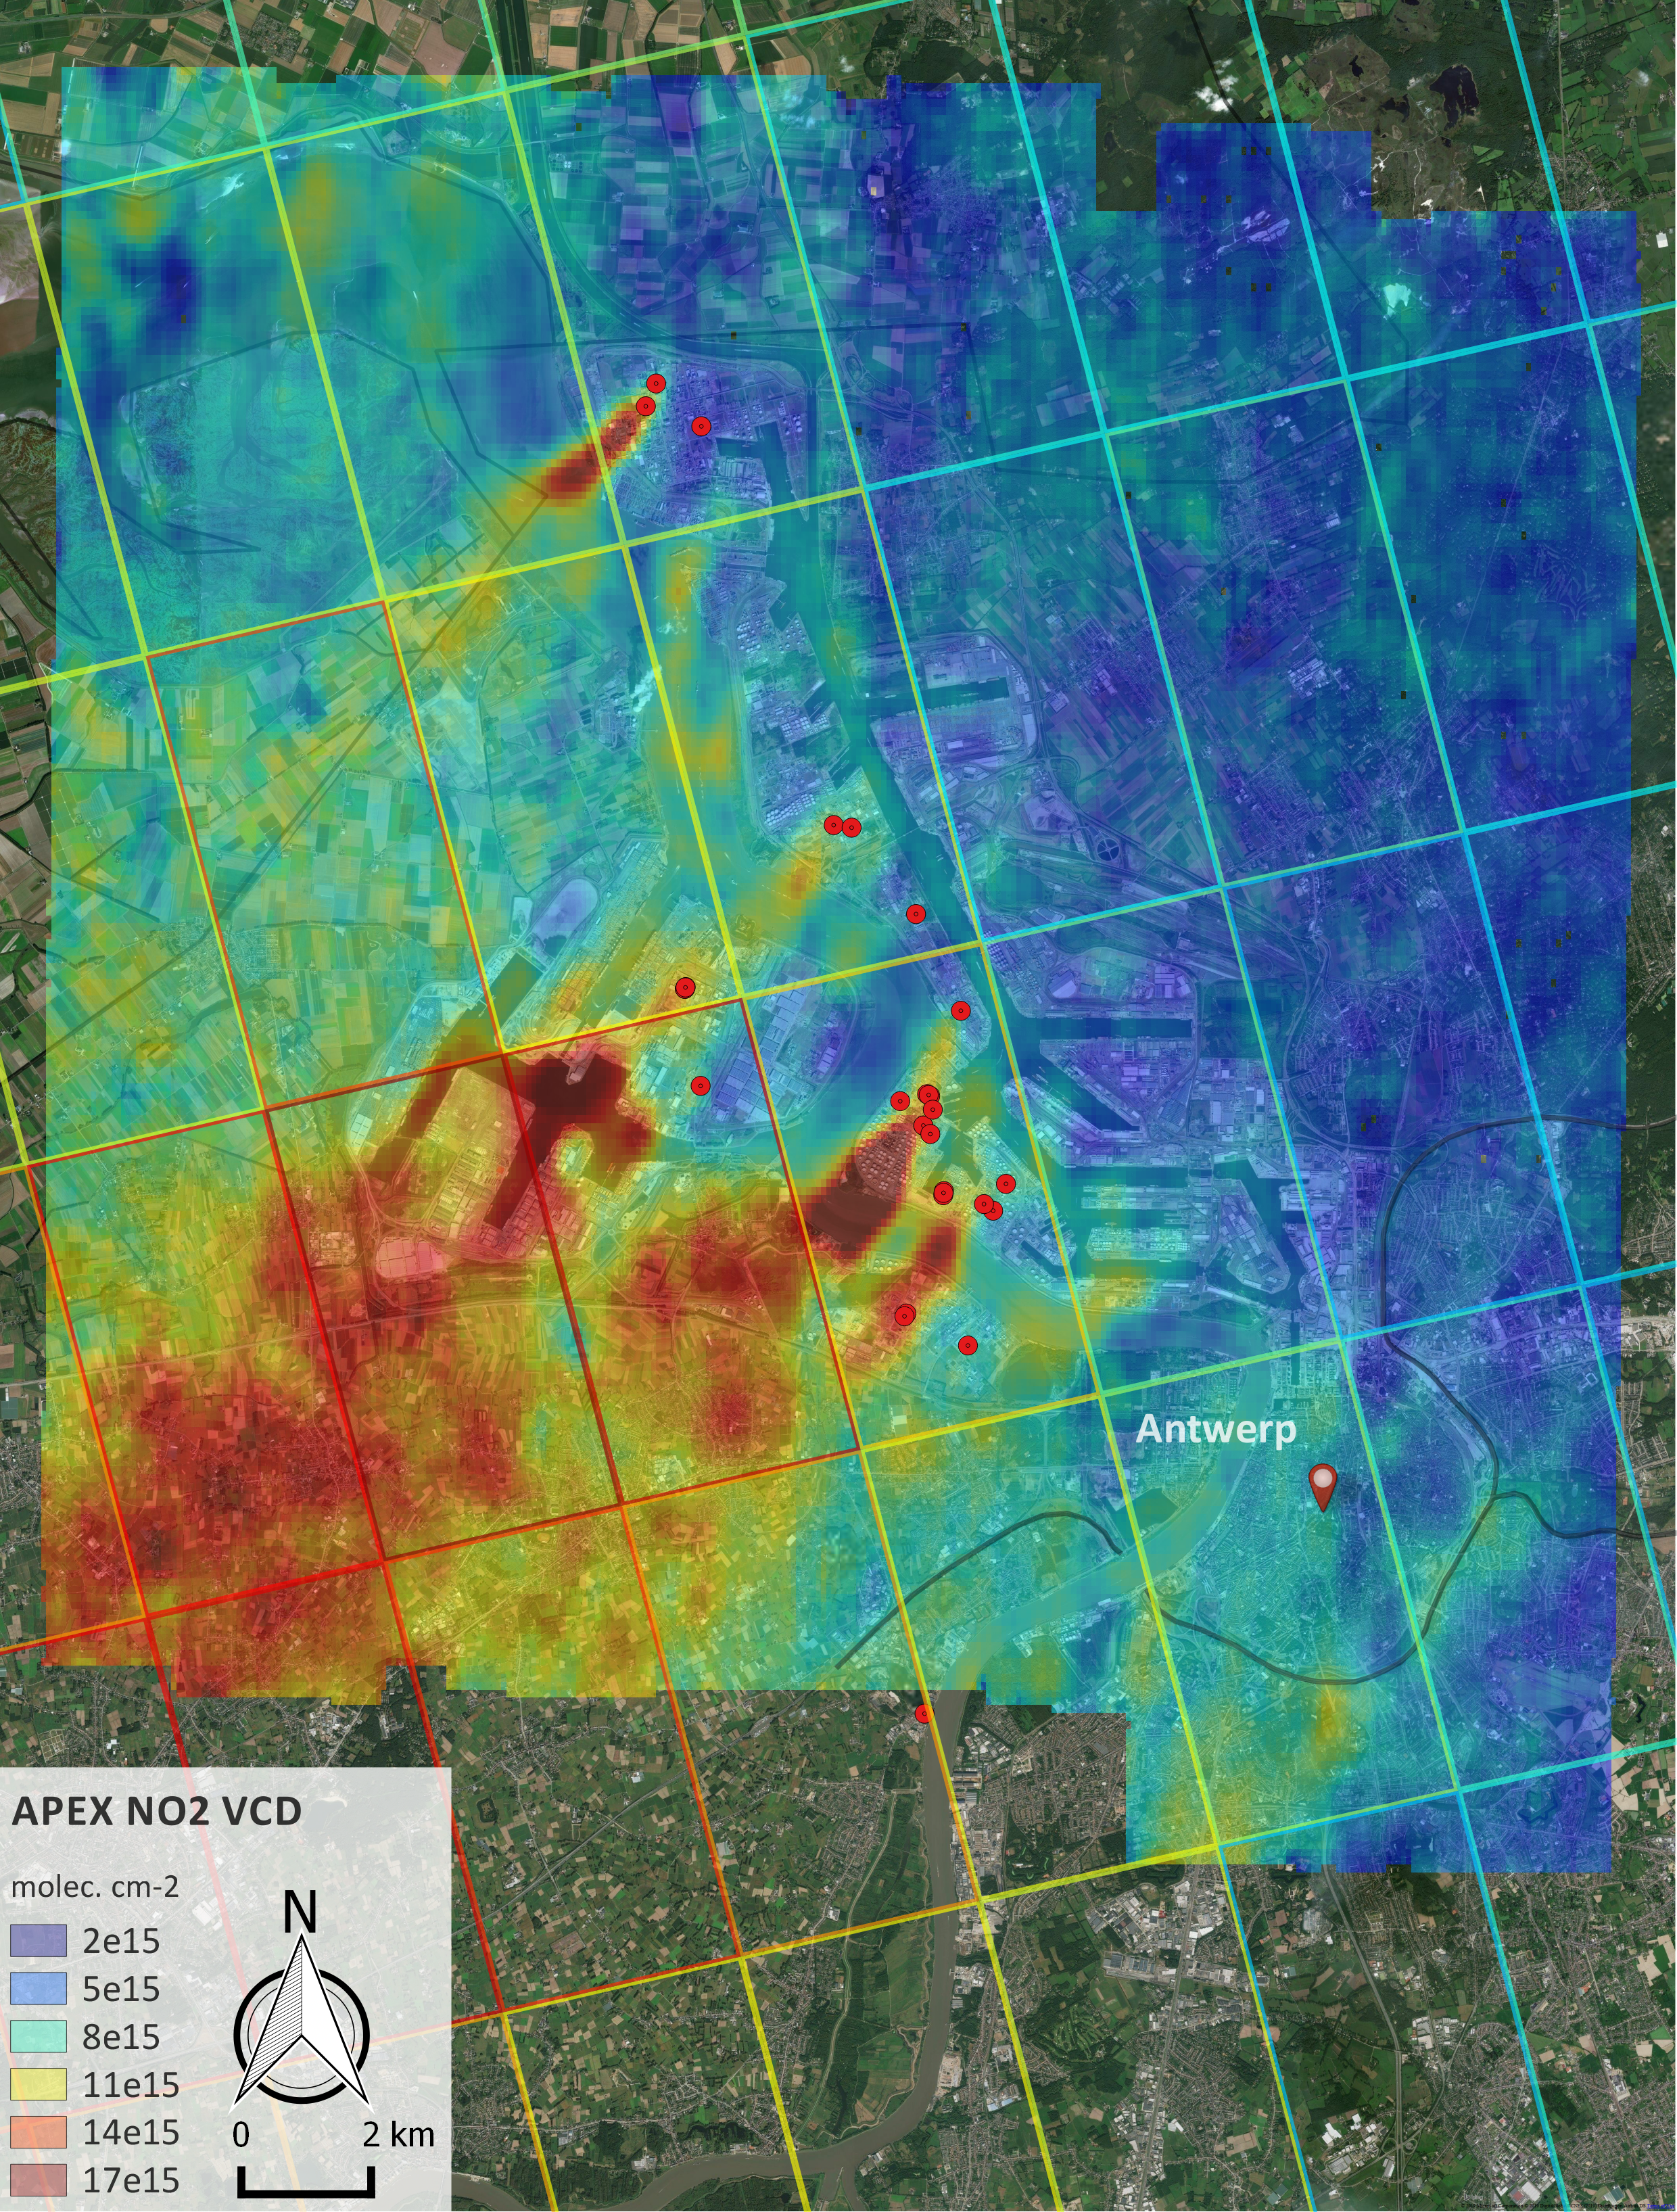
Figure 2a
Tropospheric NO2 VCD grids retrieved over Antwerp on 27 June 2019.
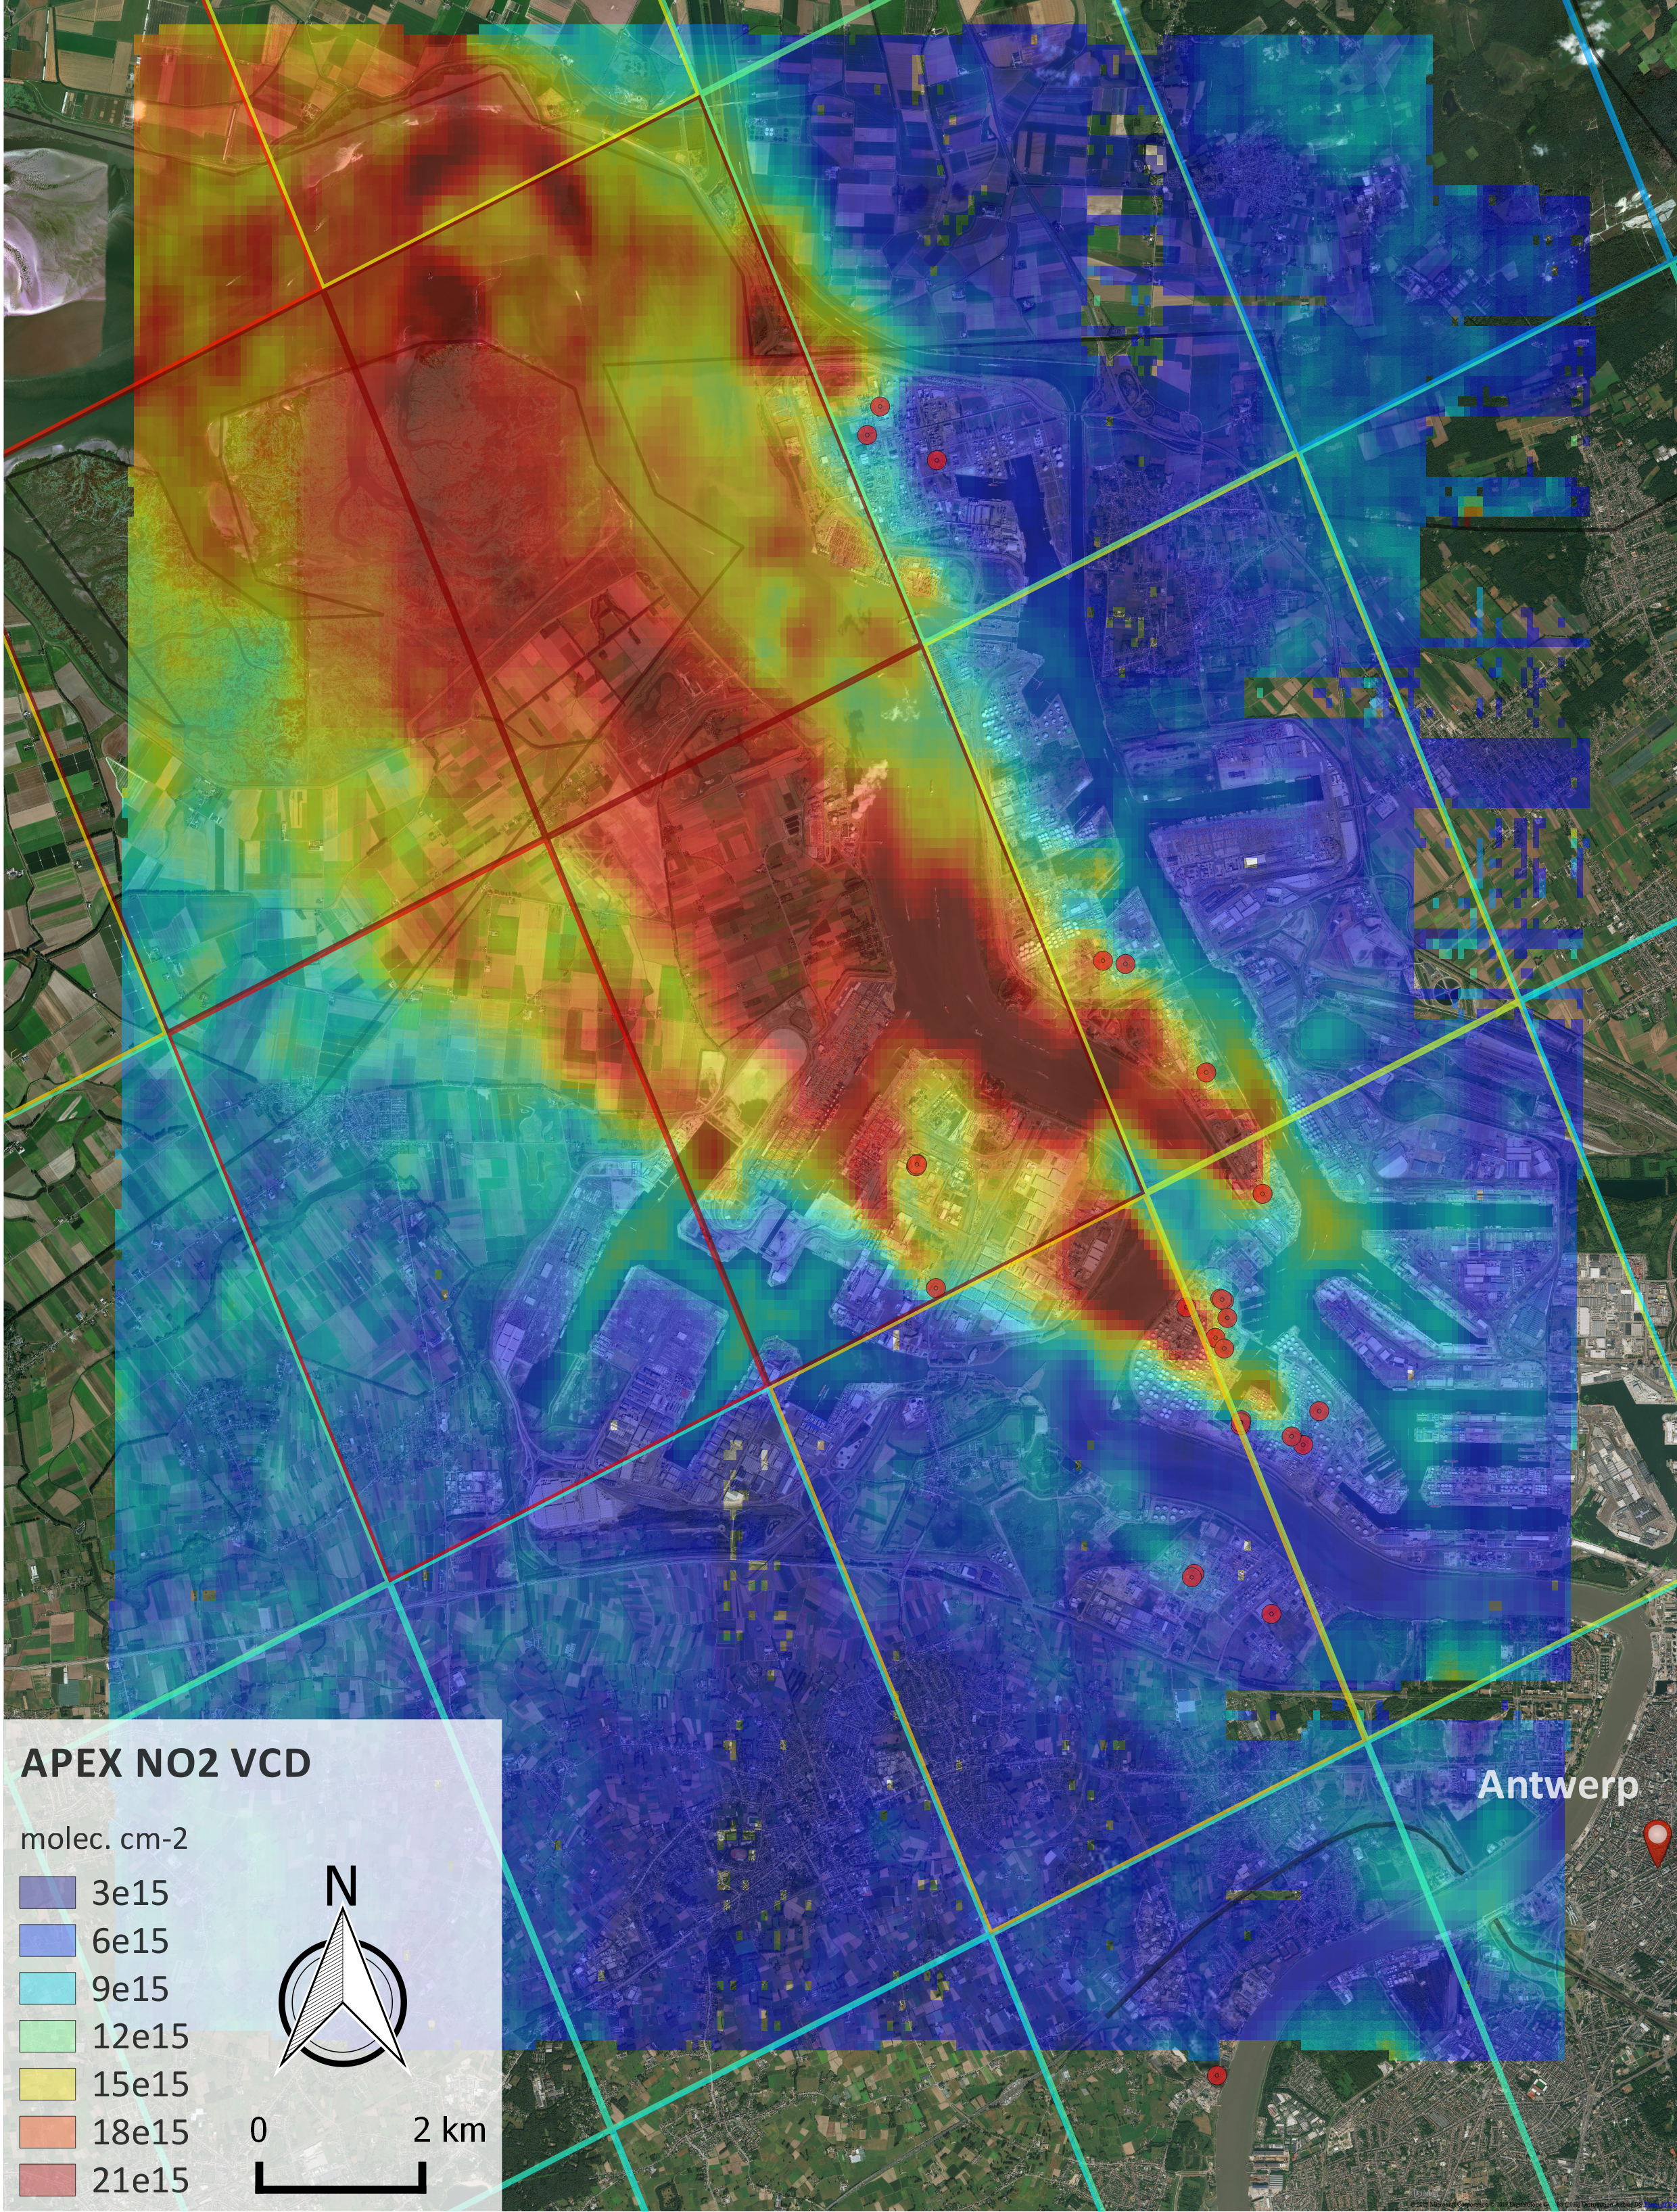
Figure 2b
Tropospheric NO2 VCD grids retrieved over Antwerp on 29 June 2019.
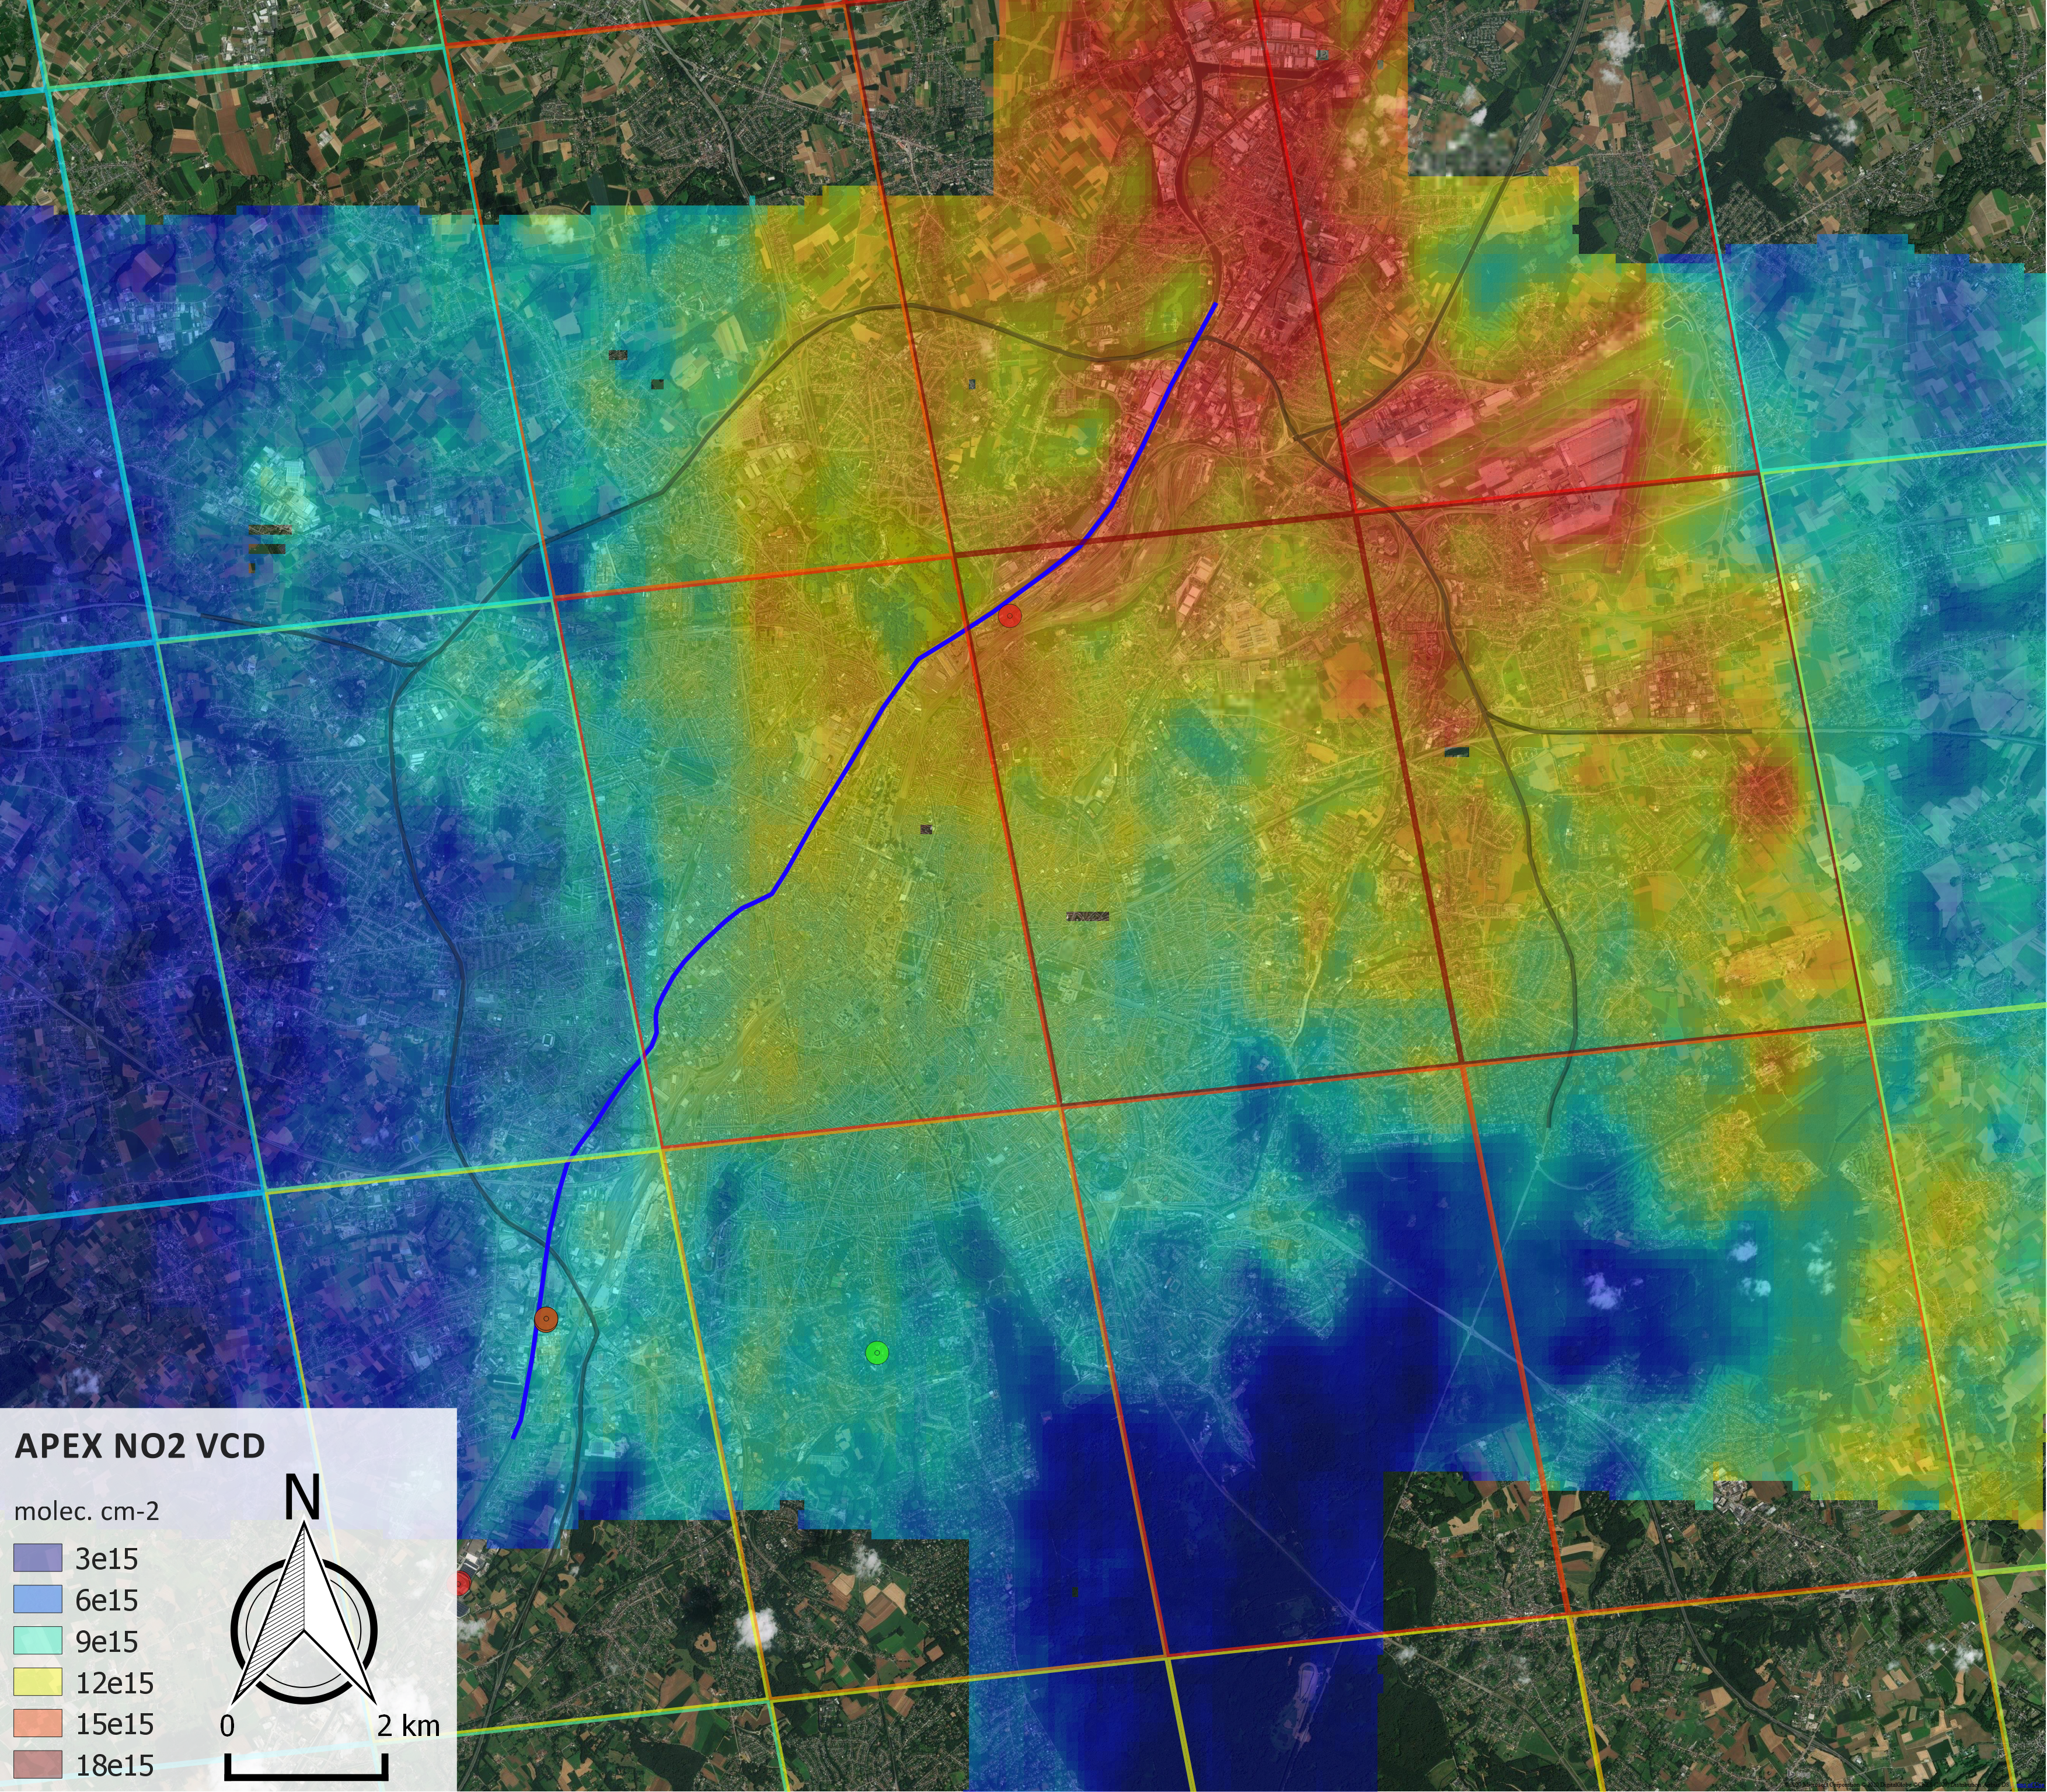
Figure 3a
Tropospheric NO2 VCD grids retrieved over Brussels on 26 June 2019.
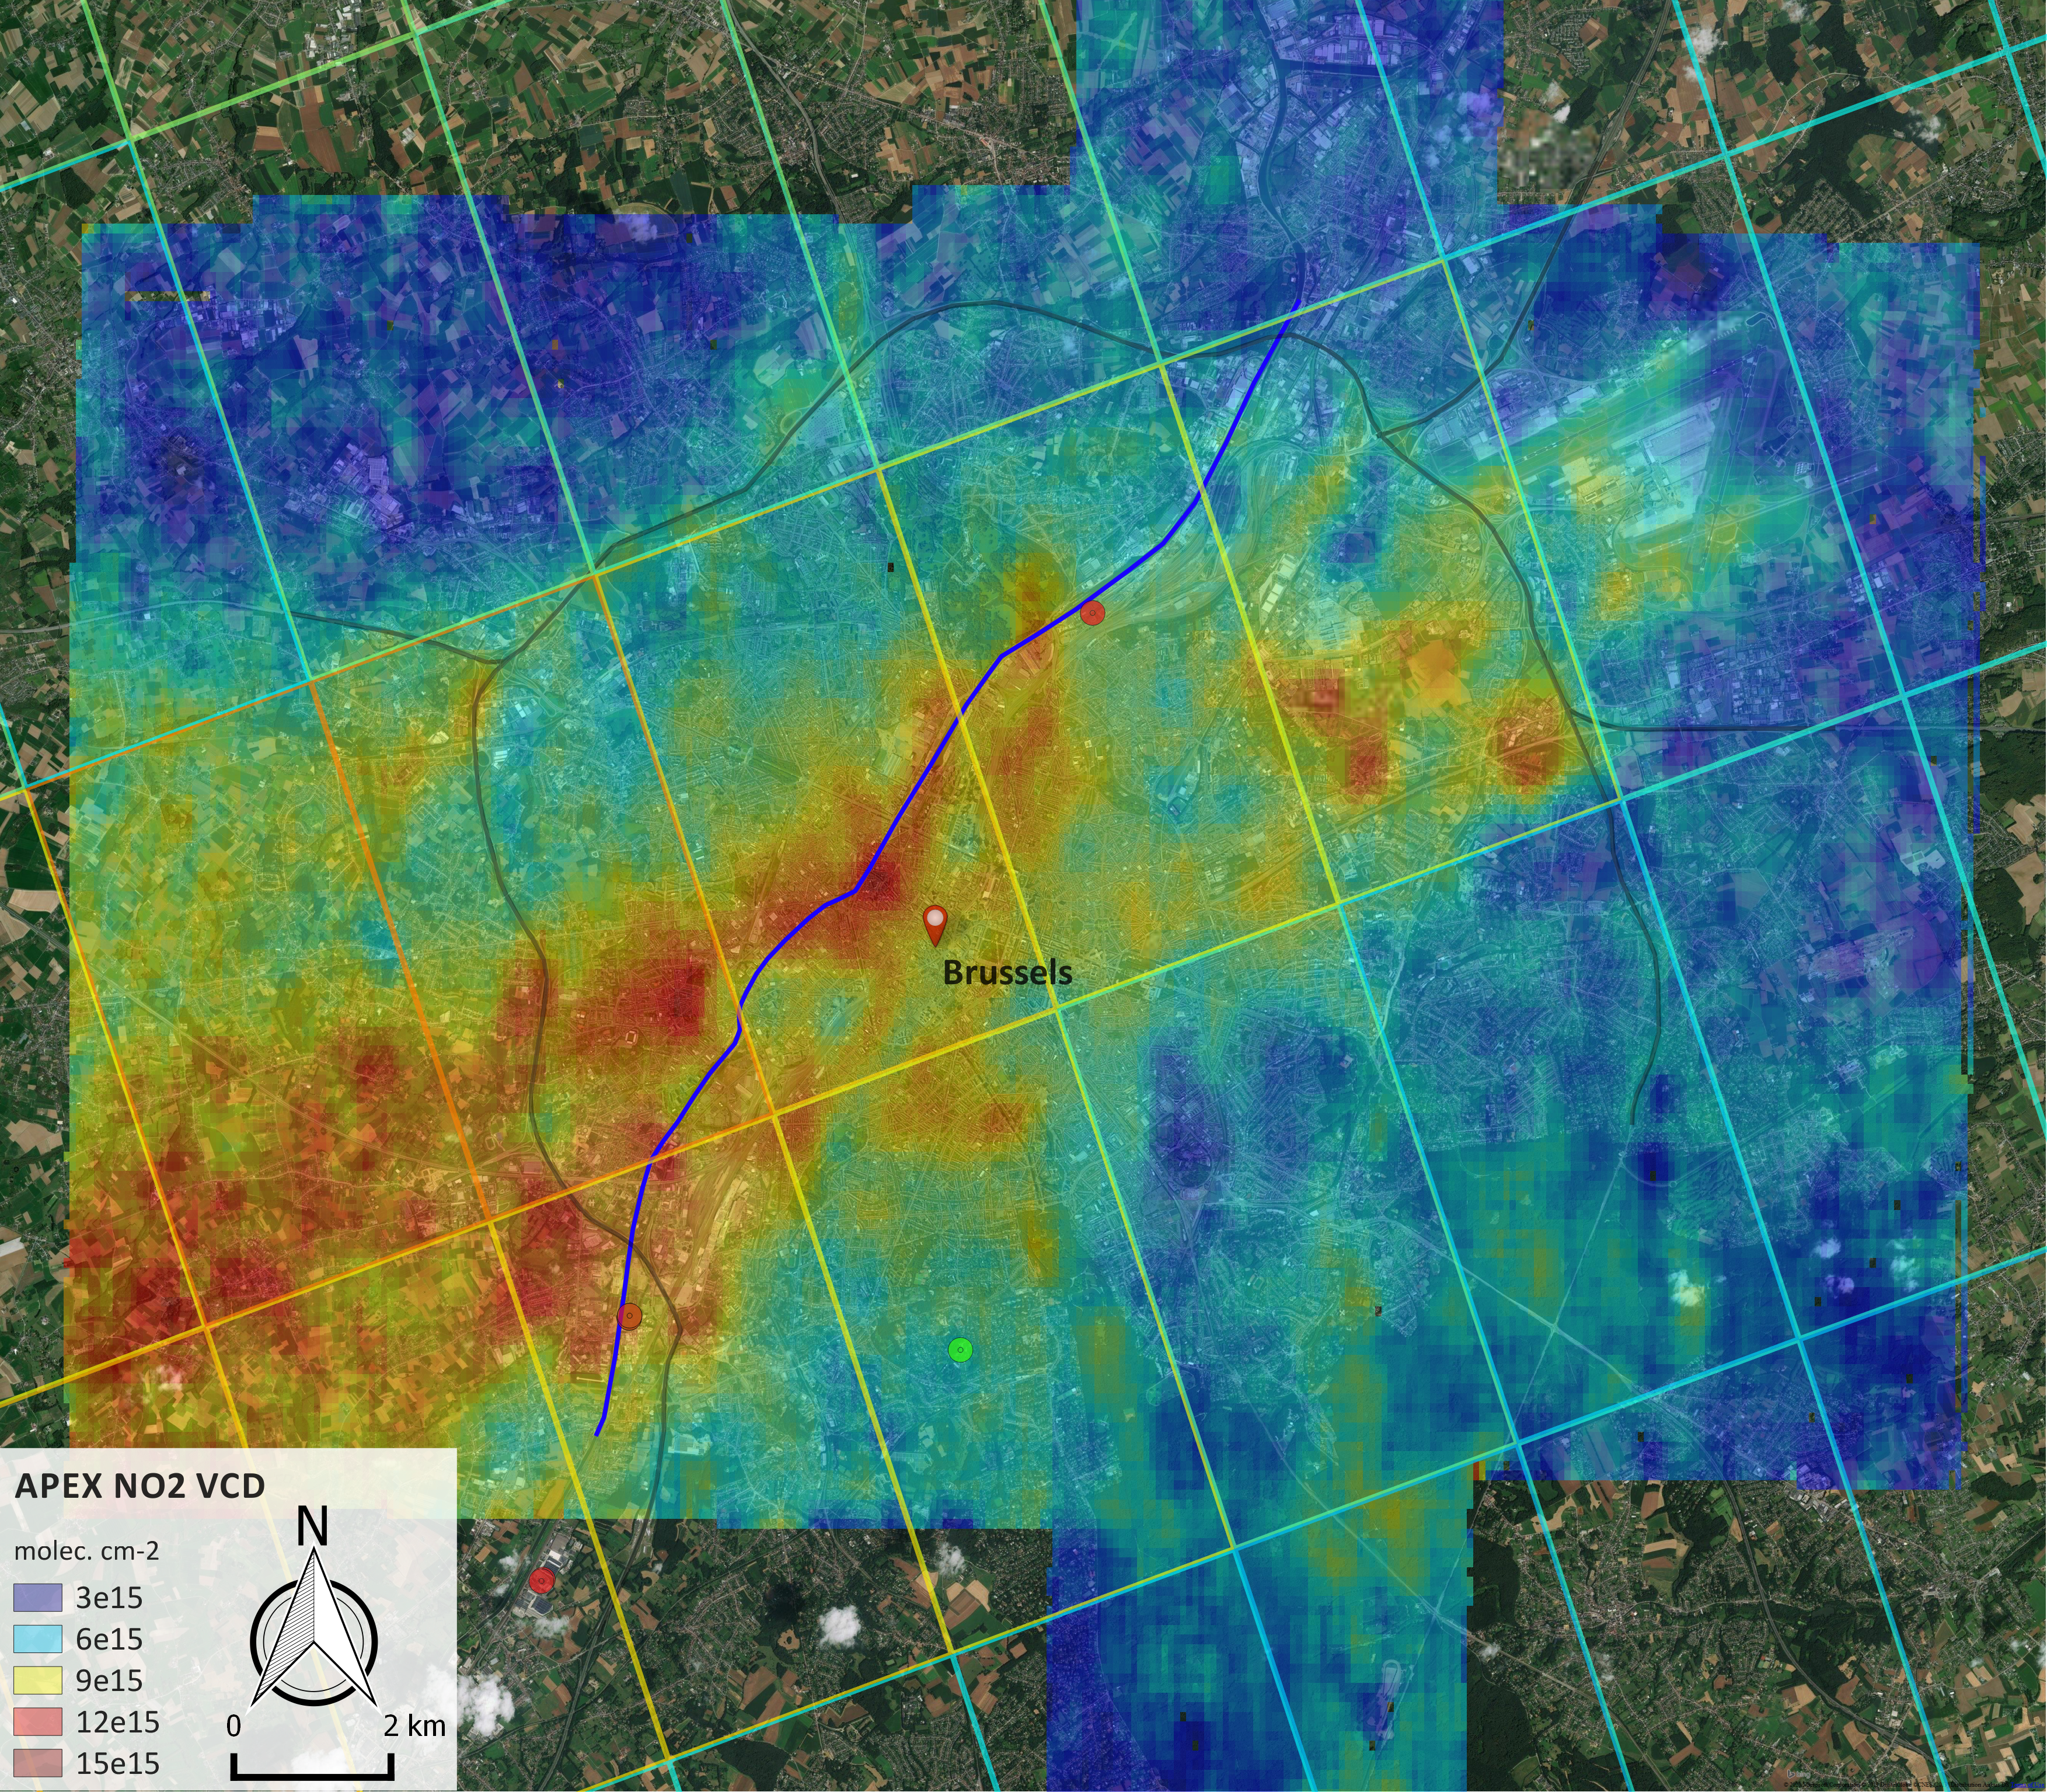
Figure 3b
Tropospheric NO2 VCD grids retrieved over Brussels on 28 June 2019.

Figure 4
Scatterplot and linear regression analysis of co-located TROPOMI and averaged APEX NO2 VCD retrievals for the data sets acquired on 26-29 June 2019. Data points are color-coded based on the number of APEX pixels averaged within a TROPOMI pixel. In this figure, TROPOMI pixels are only included in the comparison when they are covered for more than 50% by APEX pixels in order to avoid undersampling.
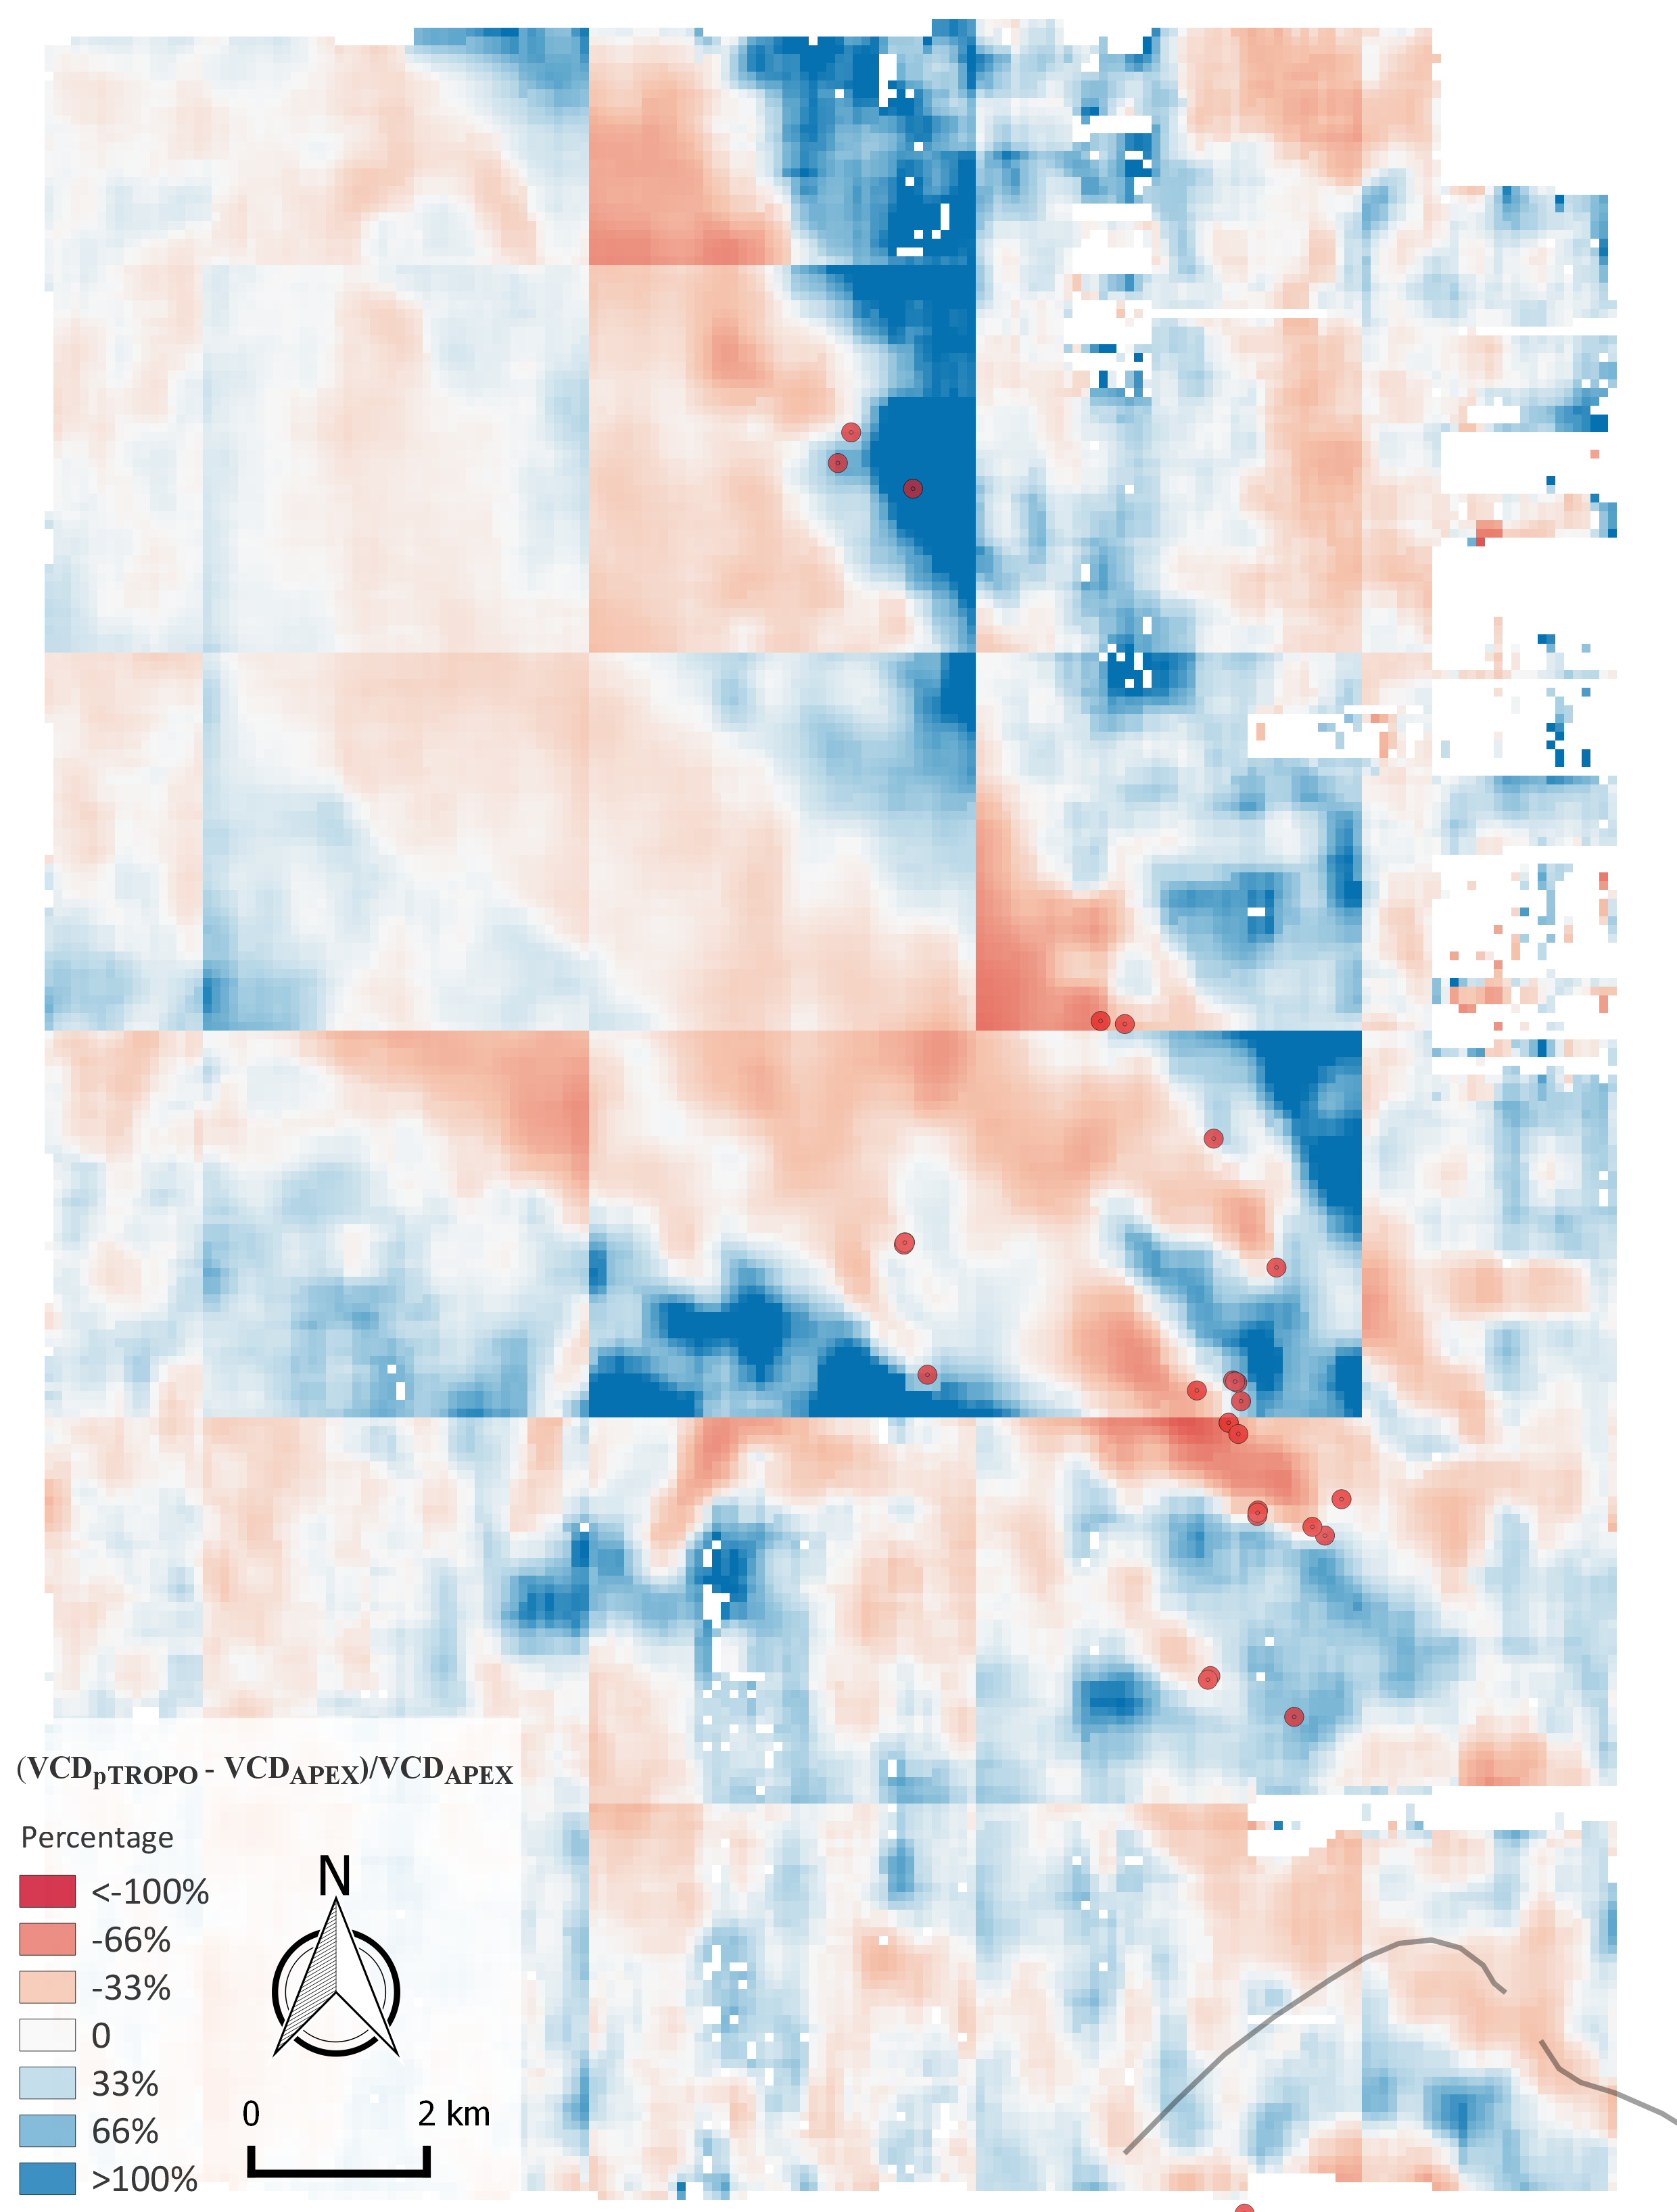
Figure 5
The NO2 VCD relative bias ((VCDpTROPOMI – VCDAPEX)/ VCDAPEX x 100) for the APEX data set acquired over Antwerp on 29 June 2019.